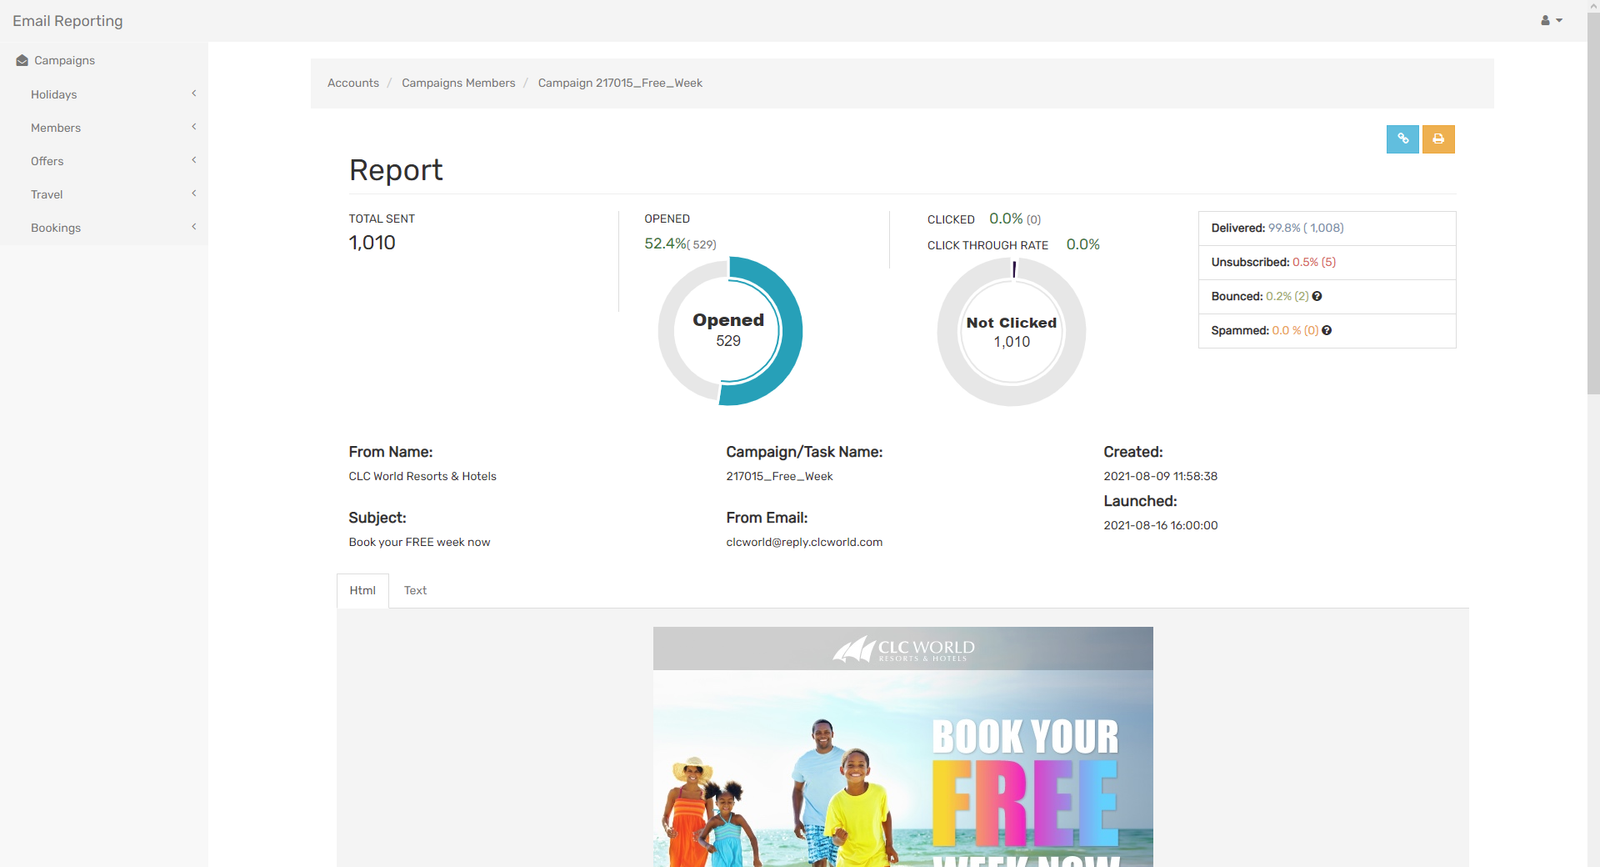
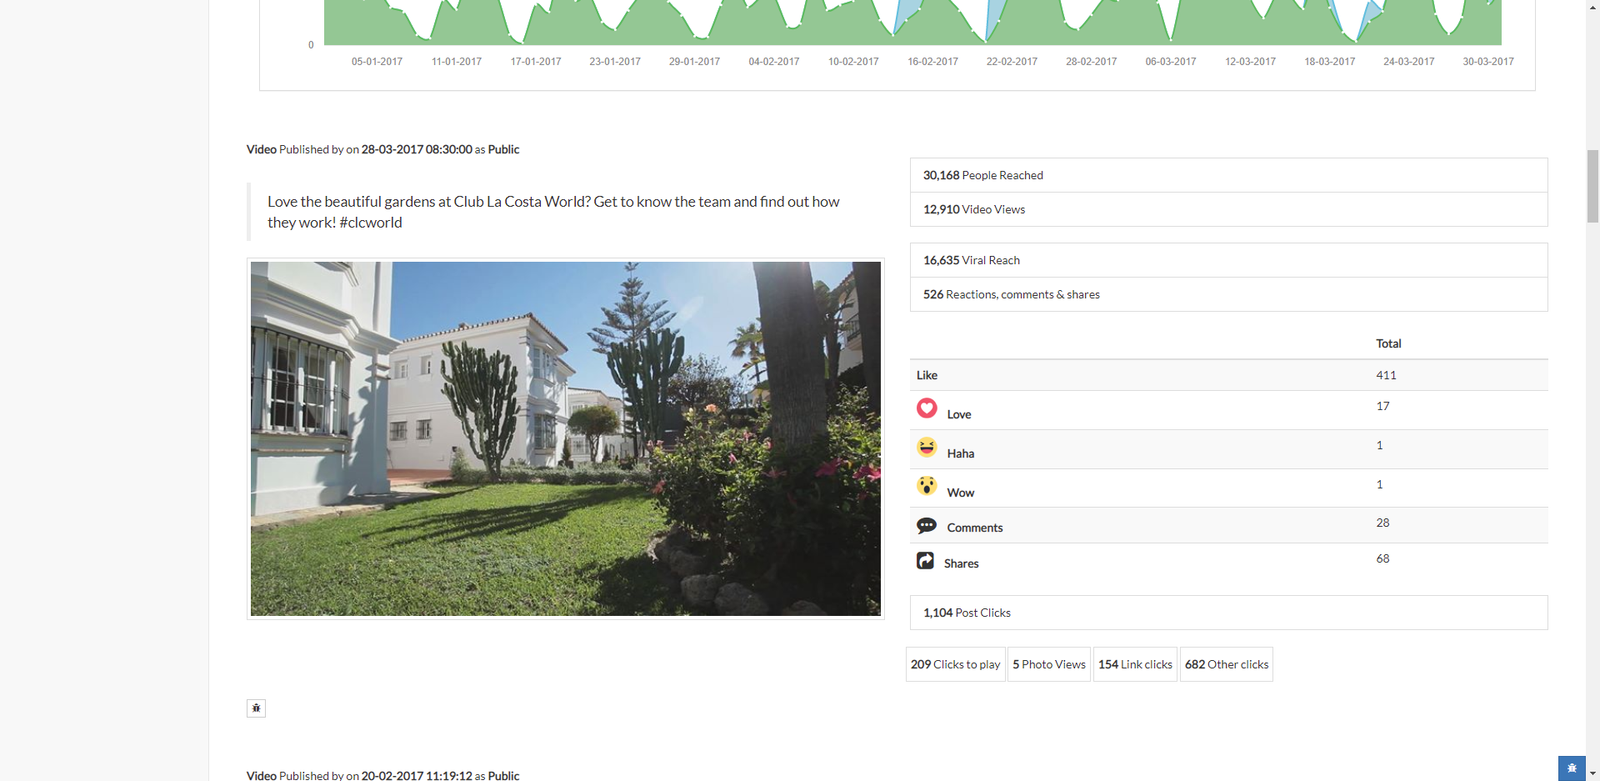
This represents a brilliant dashboard, built around serving the custom-reporting needs of the board of directors.
The app is built using mainly the Facebook API and connects to various accounts, tracking engagement reactions such as ‘likes’ etc.
It also tracks ‘reach’ over a specifiable time period, translating results into sleek-looking graphs and numerical diplays. The tool then gives the administration the ability to select particular posts,usually based on performance, and display them in a report.
The report,ofcourse, can be saved as a PDF or used to highlight realtime data. It is built with PHP and MySQL for user handling and caching, and on the front end with Twitter Bootstrap and a few handy JS Libraries, such as Morris-Charts.js charts and Datatables.js.
The dashboard also features a shortlink builder along with traffic reports, sentiment analysis and user administrator privilege funcionality.